Demand Planning on Microsoft Surface
Tinnefeld, C., Mueller, S., Becker, T. and Rudeck, F.
About
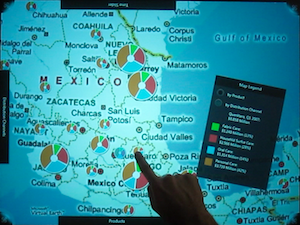
The demand planning prototype was developed at the Enterprise Platform and Integration Concepts Group at Hasso-Plattner-Institute to demonstrate the power of combining in-memory database technology and modern visualization techniques. Therefore, sales data is visualized on a Microsoft Surface table which is stored on a SAP TREX instance. The sales data is stored record by record, every interaction with the Surface table composes the corresponding analytical query that is then executed against all the sales records.
The prototype exposes widgets that can be used to navigate through the different dimensions of the data. Furthermore, it includes a time-slider that allows navigating through the different time dimensions. All data is visualized as pie charts which differ in size in relation to the specific sales volume in the particular region.
University Related Research Page